> ## Documentation Index
> Fetch the complete documentation index at: https://docs.dequan.xyz/llms.txt
> Use this file to discover all available pages before exploring further.
# The Pump Zone
## The premise
Token launches are visual events. A coin doesn't just "go up" — it accelerates, breaks through, leaves a trail, attracts a crowd, then either explodes or burns out. **You can see that.** A list cannot.
Every Solana trading tool today renders the market as a **table**. Rows of mint addresses, columns of percent-change. The interface throws away every cue our visual system is good at: motion, trajectory, density, formation, contrast.
The Pump Zone exists because we asked one question: *what would it look like if a feed could actually breathe?*
See Dequan's spatial Solana token feed in the live terminal.
## The mental model
The Pump Zone is a **live field**. Tokens are objects on the field. Their position is meaningful. Their motion is meaningful.
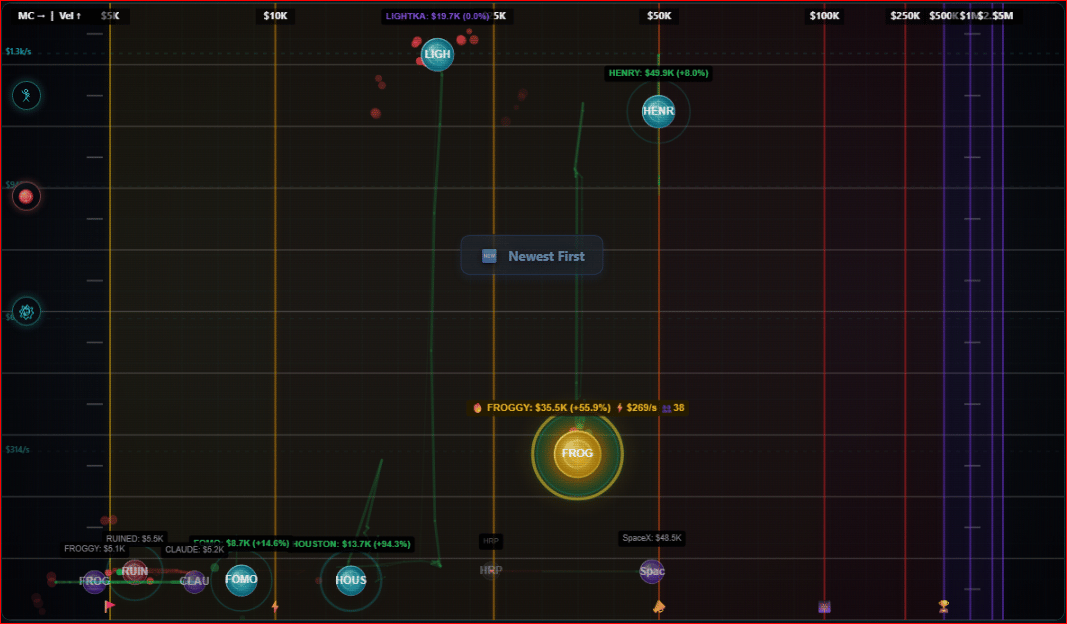 * **Horizontal position = market cap.** Newly created tokens enter from the left. Maturing tokens drift right.
* **Vertical position = velocity.** Fast climbers rise. Cooling tokens sink.
* **Glow & motion = life.** A flash means a fresh trade hit. A glide means the token is moving through MC space.
Once you've used it for ten minutes, you stop "reading" the field. You start *feeling* it. The pattern recognition that experienced traders developed over years of staring at candle charts — Dequan gives that to a beginner in their first session.
## Velocity bands
The vertical axis isn't just continuous — it's banded into four kinetic states:
Just stirring. First buyers arriving. Almost-zero velocity but trending positive.
Steady climb. Sustained green ticks. Real momentum forming.
Rapid acceleration. Crowd notices. Volatility rising.
Explosive vertical move. Often unsustainable, often the trade.
You can filter the field to **only** the bands you care about. Looking for early entries? Show Awakening + Building. Hunting parabolas? Show Pumping + Mooning. Your eye stops competing with noise.
## What's on the field
Field markers at meaningful market caps (5K, 10K, 50K, 100K, 500K). When a token crosses a marker, you see it cross — visibly. Crossing 100K MC for the first time is a real event, and it looks like one.
In the Pump Zone, every token carries a tiny sparkline of recent candles. You can read the trend without opening a chart. The Pump Zone gives you "is this real?" at a glance.
A horizontal ribbon above the field surfaces the top movers right now — ranked by recent velocity, volume, or magnitude depending on your sort. Click any leader to lock the field onto it.
Algorithmic highlights that the system thinks deserve a closer look — based on signal cluster, not paid promotion. Spotlights are surfaced with a cyan ring on the field and at the top of the leaderboard.
Tap any token and the candle drawer overlayed with: the live candle chart, token metrics and buy amount presets. The drawer is where you buy, watch the candles, and sell — all in one surface.
## Why the Pump Zone is faster than a list
A sorted list rerenders top-to-bottom on every update. Tokens have to travel from rank 47 to rank 3 over multiple frames before you'd ever see it. Your eye is reading noise, not signals.
The Pump Zone doesn't sort. It places. A token doesn't "rise to rank 3" — it rises visibly, in real space, on the same frame the trade hit our edge. Tokens in the Pump Zone don't have to rise in rank to be noticed.
Dequan can render the entire active market enabling you to see recognizable patterns at a glance.
## Where it goes from here
The Pump Zone is not just a feed view — it's the surface for everything else Dequan does:
Why position is meaningful, how the field zooms, and how to read formations.
The kinetic state machine, acceleration, and the gold velocity line.
A self-training ML model ranks every token by live pump probability. Unique to the Pump Zone.
Tap a token, the candle drawer opens, and you buy and exit from the same surface.
* **Horizontal position = market cap.** Newly created tokens enter from the left. Maturing tokens drift right.
* **Vertical position = velocity.** Fast climbers rise. Cooling tokens sink.
* **Glow & motion = life.** A flash means a fresh trade hit. A glide means the token is moving through MC space.
Once you've used it for ten minutes, you stop "reading" the field. You start *feeling* it. The pattern recognition that experienced traders developed over years of staring at candle charts — Dequan gives that to a beginner in their first session.
## Velocity bands
The vertical axis isn't just continuous — it's banded into four kinetic states:
Just stirring. First buyers arriving. Almost-zero velocity but trending positive.
Steady climb. Sustained green ticks. Real momentum forming.
Rapid acceleration. Crowd notices. Volatility rising.
Explosive vertical move. Often unsustainable, often the trade.
You can filter the field to **only** the bands you care about. Looking for early entries? Show Awakening + Building. Hunting parabolas? Show Pumping + Mooning. Your eye stops competing with noise.
## What's on the field
Field markers at meaningful market caps (5K, 10K, 50K, 100K, 500K). When a token crosses a marker, you see it cross — visibly. Crossing 100K MC for the first time is a real event, and it looks like one.
In the Pump Zone, every token carries a tiny sparkline of recent candles. You can read the trend without opening a chart. The Pump Zone gives you "is this real?" at a glance.
A horizontal ribbon above the field surfaces the top movers right now — ranked by recent velocity, volume, or magnitude depending on your sort. Click any leader to lock the field onto it.
Algorithmic highlights that the system thinks deserve a closer look — based on signal cluster, not paid promotion. Spotlights are surfaced with a cyan ring on the field and at the top of the leaderboard.
Tap any token and the candle drawer overlayed with: the live candle chart, token metrics and buy amount presets. The drawer is where you buy, watch the candles, and sell — all in one surface.
## Why the Pump Zone is faster than a list
A sorted list rerenders top-to-bottom on every update. Tokens have to travel from rank 47 to rank 3 over multiple frames before you'd ever see it. Your eye is reading noise, not signals.
The Pump Zone doesn't sort. It places. A token doesn't "rise to rank 3" — it rises visibly, in real space, on the same frame the trade hit our edge. Tokens in the Pump Zone don't have to rise in rank to be noticed.
Dequan can render the entire active market enabling you to see recognizable patterns at a glance.
## Where it goes from here
The Pump Zone is not just a feed view — it's the surface for everything else Dequan does:
Why position is meaningful, how the field zooms, and how to read formations.
The kinetic state machine, acceleration, and the gold velocity line.
A self-training ML model ranks every token by live pump probability. Unique to the Pump Zone.
Tap a token, the candle drawer opens, and you buy and exit from the same surface.